Finding The Best No-code Data Visualization Tools
Picture this: you're staring at a pile of data so large it could give Mount Everest a run for its money. You know there are valuable insights buried in there somewhere, but where to begin? You get a headache as you navigate the maze of spreadsheets and graphs, wondering if there's a better way. That's where no-code data visualization tools steps in.
The sheer volume of data available to businesses today can be overwhelming. But we can’t deny data’s importance in deriving valuable insights. With traditional BI tools proving complex, time-consuming, costly, and requiring specialized expertise to use them effectively, they are slowly turning obsolete. They may also be contesting to integrate with other tools and services, creating silos of information that are hard to break down. Situations like these can lead to lost productivity, missed opportunities, and, ultimately, lost revenue.
Thankfully, no-code data visualization tools are changing the game. These tools allow businesses of all sizes and industries to access and analyze data without requiring specialized technical skills. Actionable insights are leading the game with customizable dashboards, drag-and-drop functionality, and real-time data integration. And only a no-code tool user would know to lead the way.
In this article, we'll explore the key factors to consider when choosing the best no-code data visualization tool for your business. From customization options to data integration capabilities and access to collaboration features, we'll cover everything you need to know to move in the right direction.
So, if you have had enough of drowning in data and are ready to make the most of your information, let's dive into some clarity!
What is no-code data visualization?
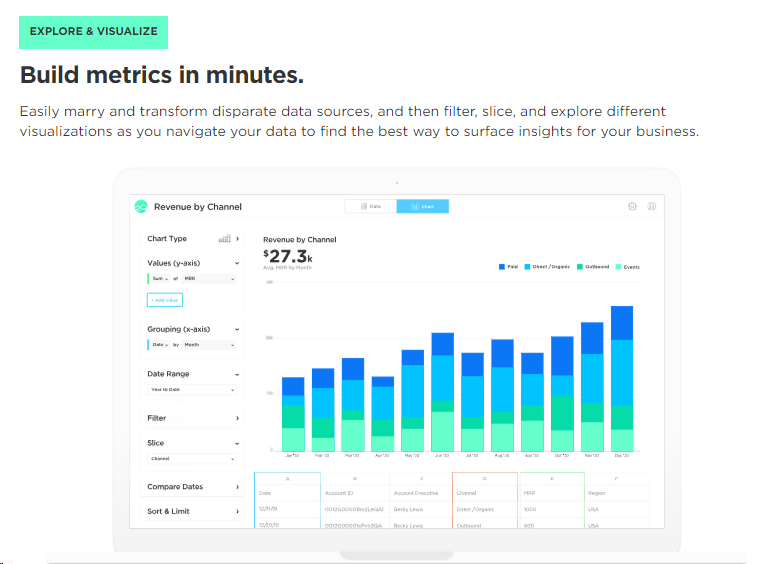
No-code data visualization tools enable businesses to create interactive and visually appealing charts, graphs, and other data visualizations without the need for programming knowledge. These tools typically use a drag-and-drop interface, allowing users to customize their visualizations' look and feel effortlessly.
Why are no-code data visualization tools beneficial?
Their benefit to businesses ranges from helping them make data more accessible and easier to understand. With visualizations, data can be presented in a way that is more intuitive and engaging, making it easier for users to identify trends, patterns, and insights. This can lead to faster and better-informed decision-making and improved communication and collaboration among teams.
How can no-code data visualization tools enhance business intelligence?
No-code data visualization tools can enhance business intelligence by giving users a more efficient and effective way to analyze data. By making data more accessible and easier to understand, these tools can help users to identify patterns and insights that might otherwise go unnoticed. This can lead to more accurate predictions, better-informed decisions, and a more agile and competitive business.
Key Features to Look for in No-Code Data Visualization Tools
#1-Customization Options
When choosing a no-code data visualization tool, it's essential to look for one that offers a range of customization options. This should include changing colors, fonts, and other visual elements and adding interactive features like hover-over effects, filters, and animations.
#2-Data integration capabilities
Data integration is another feature that decides the use of BI. This includes connecting to various data sources, such as spreadsheets, databases, and cloud-based services. No-Code Business Intelligence tools usually have visualization features that allow users to manipulate the data as needed, such as filtering or sorting, to create more customized visualizations.
#3-Accessibility and ease of use
No-code data visualization tools should be easy to use and accessible to all users, regardless of technical skill level. This means that the tool should have an intuitive interface that allows users to quickly create and edit visualizations and provide helpful tutorials and guides to assist users in getting started.
#4-Collaboration features
The tool should allow multiple users to work on the same project simultaneously and provide tools for sharing and discussing visualizations. This can foster directive collaboration and communication among teams.
#5-Security and compliance
Lastly, security and compliance features should be considered when choosing a no-code data visualization tool. No-Code Business Intelligence tools should have adequate measures in place to protect sensitive data, such as encryption and access controls. It should also comply with relevant regulations and standards, such as GDPR and HIPAA.
Factors to Consider when Choosing a No-Code Data Visualization Tool
A. Budget
You might be tempted to choose a more affordable option for a no-code data visualization tool but ensure you're not compromising on the functionalities as per your organizational needs. While many affordable options are available, some tools are expensive. It's crucial to weigh the costs against the potential benefits to determine if the investment is worthwhile.
B. Scalability
Scalability is another important consideration, particularly for businesses anticipating significant growth or data volume changes. The tool should be able to handle increasing amounts of data and users without sacrificing performance or quality.
C. User support and training resources
No-code data visualization tools should offer adequate user support and training resources. This includes a comprehensive knowledge base, helpful tutorials, and responsive customer service. This can help users quickly resolve any issues or questions that may arise.
Grow offers a range of support options such as FAQs/Forum, Knowledge Base, Chat, Email/Help Desk, 24/7 (Live rep). Their training facilities have Videos, Webinars, Live, In-person-training and much more to choose from. Learn more on Grow Reviews 2022.
D. Integration with other tools
In any case, integration can reduce your efforts towards collecting data thousands of times. Therefore, No-Code Business Intelligence software should be able to integrate seamlessly with other tools and services your business already uses, such as CRM or marketing automation platforms. Streamlining workflows and reducing the need for manual data entry is the ultimate win-win for both organizations and users.
E. Reviews and user feedback
Lastly, reading reviews and user feedback before choosing a no-code data visualization tool is essential. This can provide valuable insights into the tool's strengths, weaknesses, and any issues or challenges users may have encountered. Testing the tool through a free trial or demo can also get a feel for its capabilities and usability. Grow is one such tool for No-Code Business Intelligence, offering a free demo.
Key Takeaways
No-Code Business Intelligence tools can help businesses to make data more accessible and understandable, leading to faster and better-informed decision-making. Consider all the above factors and choose a BI and visualization tool that resonates with your needs and users’ technical knowledge above all.
Grow is a comprehensive Business Intelligence platform with a no-code data visualization tool, data integration, analytics, and collaboration features. It offers a range of plans to suit businesses of all sizes. Our no-code data visualization tool emphasizes collaboration and data governance.
Access a range of customization options, data modeling, and exploration features and make a much-needed difference to your analytics game!

Comments
Post a Comment